


A real estate developer marketing report should help leadership decide what to promote, price or release next. Most reports stop at clicks, leads and cost per lead. Those numbers say little about which unit types attract real buyers, which price bands stall, or where to move budget. Connect enquiries to inventory, track them to visits and reservations, and the monthly report becomes a decision tool rather than a formality.
The problem with typical reports
A typical agency or in-house report shows:
- Impressions, clicks and CTR.
- Leads and cost per lead by channel.
- A few creative screenshots.
Directors read it, nod, and ask the same questions every month: "Why are townhouses not selling?", "Should we change the price?", "Is the new campaign working?" The report cannot answer, because it does not connect marketing to inventory and sales.

What leadership actually needs to know
- Which projects and unit types attract qualified demand?
- Which price bands get enquiries but no visits?
- Which channels produce reservations, not just leads?
- Where are leads being lost: contact, qualification or visits?
- What should change next month: budget, message, price or release?
Build the report to answer these.
The structure of a useful report
Summary
Three to five key findings and the recommended actions, on one page.
Funnel by project
Leads, contacted, qualified, visits, reservations, with conversion rates between stages.
Demand by unit type and price band
Qualified leads and visits per unit type, compared with available inventory. This shows where demand and supply do not match.
Channel performance
Cost per qualified lead and reservations by channel.
Rejection reasons
Top reasons leads did not qualify, by project. Budget, location and timeline patterns point to message or pricing issues.
Actions and owners
What will change, who owns it, and when it will be reviewed.
Connect marketing data to inventory
To do this, each lead in the CRM needs:
- Project and unit type of interest.
- Budget band.
- Source and campaign.
- Stage and outcome.
The inventory system needs current availability by unit type. Combining the two shows, for example, that two-bedroom units have strong qualified demand and low availability, while three-bedroom units have weak demand and high availability.

Turning findings into decisions
Examples of what a good report enables:
- Strong demand for a unit type with limited stock: consider a price review or phase release.
- Weak demand for a unit type: test a new message or audience, or review pricing.
- Many budget rejections in one price band: check whether the ad shows the right starting price.
- One channel producing most reservations: shift budget toward it.
Marketing cannot decide pricing alone, but it can provide the evidence.
Keep the report honest
Be clear about what the data shows and what it does not. If sample sizes are small, say so. If tracking has gaps, say so. If reservations cannot yet be linked to campaigns reliably, report that as a limitation. Leaders trust reports that admit uncertainty more than reports where every number looks perfect. More on this in marketing and sales dashboards.
Make it readable in five minutes
Senior leaders often read reports on their phones between meetings. Put the summary first, with findings and actions. Use simple tables, not dense dashboards. Highlight changes from last month with clear arrows or colours. Put detailed tables in an appendix. If a director can understand the main message in five minutes, the report will be used. If it takes thirty, it will be skimmed and forgotten.

Bring sales voice into the report
Numbers show what happened. Sales feedback explains why. Add a short section with the top three things advisers heard from buyers this month: common objections, popular unit types, concerns about price or handover. This context helps leadership interpret the numbers and often reveals issues the data alone would miss, such as a competing launch with a better payment plan.
How often to report
Weekly: short operational view for marketing and sales. Monthly: full report for leadership with decisions. Quarterly: strategic review of channel mix, markets and the next project.
Track a few numbers over time
Monthly snapshots are useful. Trends are more useful. Keep a simple tracker of five or six numbers across months: qualified leads, cost per qualified lead, contact rate, visit rate, reservations and top rejection reason. Over a quarter, you can see whether changes actually improved the funnel or whether a good month was just noise. Trends also help leadership see that marketing decisions are based on evidence, not on one week's results.
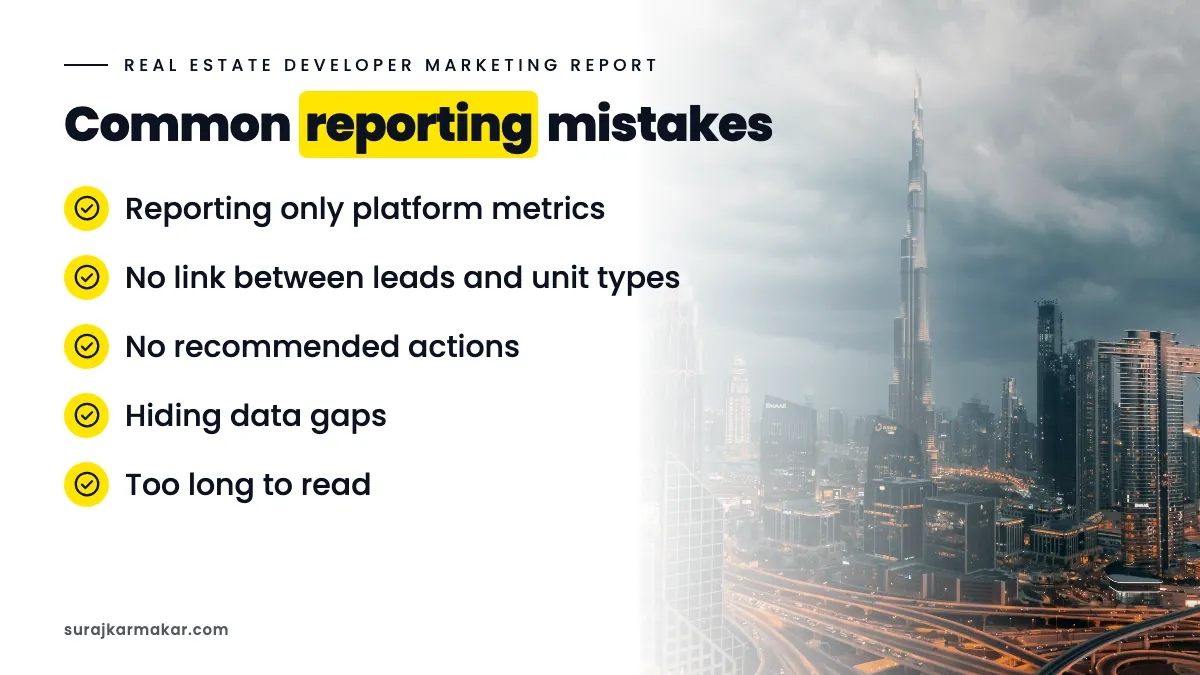
Common reporting mistakes
- Reporting only platform metrics.
- No link between leads and unit types.
- No recommended actions.
- Hiding data gaps.
- Too long to read.
An illustrative example
Not a client result: a developer's monthly report shows lead volume by channel only. After adding demand by unit type, leadership sees strong qualified demand for one unit type that is nearly sold out, and weak demand for another with plenty of stock. Marketing shifts creative to the slower unit type and sales reviews its pricing.
Frequently asked questions
What KPIs should a developer marketing report include?
Qualified leads, cost per qualified lead, visits and reservations by project, unit type and channel, plus contact rate and top rejection reasons.
Who should own the developer marketing report?
Usually the marketing lead, with sales data provided by sales operations. Both teams should agree the definitions.
Next step
Reports should drive inventory and budget decisions. See my approach to real estate marketing for developers in Dubai, read about real estate marketing ROI, or ask me to review your current report.
Explore the wider framework: Marketing for Dubai developers.
What does this look like in your team?
If your team is working through a similar challenge, get in touch to discuss where a focused review could help.
Discuss your real estate campaign