
A real estate lead quality report can lead you badly wrong if it draws big conclusions from small numbers. "This campaign had 2 qualified leads out of 10, so it is terrible" might be true, or it might be bad luck. Many budget decisions in property marketing are made on samples too small to mean anything. Compare cohorts fairly, show sample sizes, wait for enough data, and your quality report will support better decisions.
The small-sample trap
It happens all the time. A new campaign runs for a week. Sales reviews the first 15 leads and finds 3 qualified. Another campaign had 6 qualified out of 15. The first campaign gets cut. Next month, nobody remembers that the difference was 3 leads.
Small numbers swing wildly. A few leads in either direction can make a campaign look great or terrible. Deciding on them is closer to guessing than analysis.

Compare cohorts, not snapshots
A cohort is a group of leads acquired in the same period from the same source. Compare cohorts at the same age:
- Leads from week 1, measured 14 days after acquisition.
- Leads from week 2, measured 14 days after acquisition.
Do not compare leads acquired yesterday with leads acquired last month. Older leads have had more time to be contacted, qualified and visit.
Show sample sizes
Every quality rate in the report should show the count behind it: "Qualified: 18% (9 of 50)". Readers can then judge whether the difference is meaningful. A campaign with 9 of 50 and another with 6 of 30 are not clearly different.
Wait for enough data
Agree minimum thresholds before judging. For example:
- At least 30 to 50 leads per campaign before comparing quality.
- At least 14 to 30 days of follow-up per cohort.
These are practical guides, not statistical rules. For important decisions, more data is better. If a campaign cannot reach the minimum in a reasonable time, combine similar campaigns for analysis, or extend the review period, rather than drawing firm conclusions from a handful of leads.

Look at trends, not single weeks
Plot qualification rate by weekly cohort over time. A single bad week may be noise; three bad weeks in a row is a signal. Trends also show the effect of changes: did qualification rise after the creative change?
Separate pending from failed
Leads not yet contacted or still in progress are pending, not failed. If a report counts them as unqualified, new campaigns always look worse. Show pending separately until the follow-up window closes.
Combine numbers with reasons
Rates tell you how much; reasons tell you why. Reasons are also less sensitive to small samples, because a clear pattern, such as most rejections citing budget, is visible even in modest numbers. Show the top rejection reasons for each cohort. If a campaign's qualification rate is low and most rejections are budget-related, the fix is clear even with modest numbers.
A simple report structure
For each campaign:
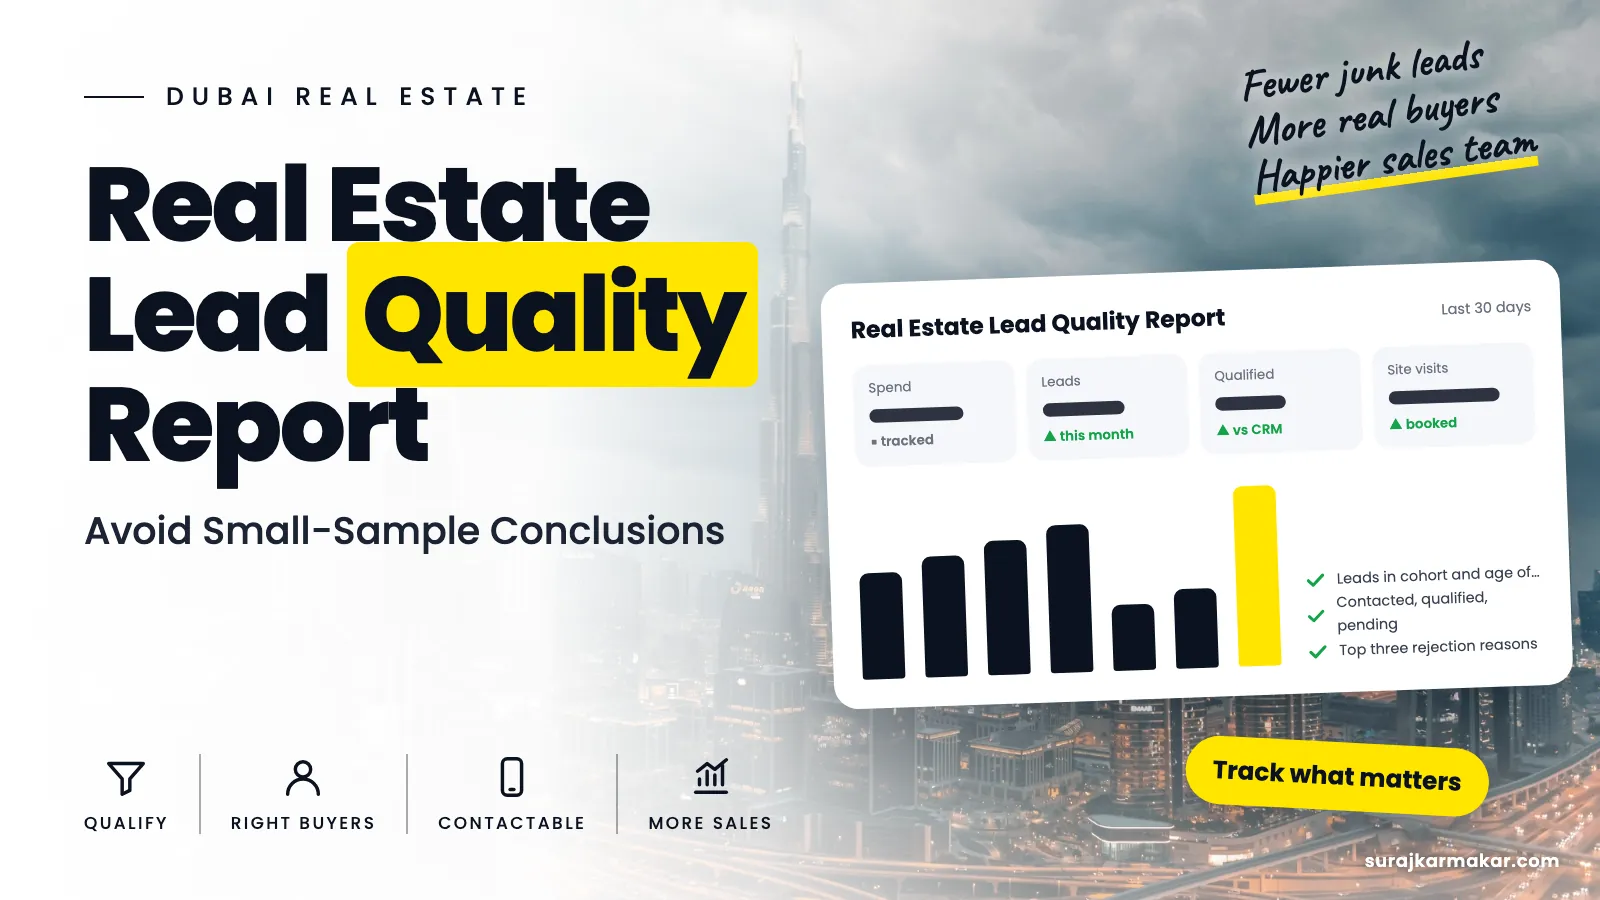
- Leads in cohort and age of cohort.
- Contacted, qualified, pending: counts and rates.
- Top three rejection reasons.
- Cost per qualified lead.
- Trend versus previous cohorts.
- Note on data quality or changes.
More on structured reporting in real estate marketing dashboards.

When you must decide early
Sometimes you cannot wait. A launch is short, or budget is limited. In that case, decide on the clearest signals: broken tracking, very high invalid rates or a reason pattern that is obvious, such as most leads asking for rentals. Avoid fine comparisons between campaigns with similar numbers. Make the decision reversible: reduce budget rather than stop, and review again when more data arrives.
Explain uncertainty in plain words
Directors do not need statistics lectures. They need plain statements. "Campaign A looks better so far, but the difference is small and based on 40 leads each. We will review again in two weeks." That sentence protects the business from overreacting and still gives a direction. Reports that state uncertainty clearly earn more trust over time than reports that present every difference as a definite win.
Note every change in the report
Quality numbers change for many reasons: a new creative, a different form, a price update, a new adviser, a tracking fix. Add a short change log to the report so readers can connect shifts in quality to what actually happened. Without it, teams often credit or blame the wrong thing.
Common reporting mistakes
- Comparing leads of different ages.
- Hiding sample sizes.
- Counting pending leads as failures.
- Cutting campaigns after a week.
- Ignoring rejection reasons.

An illustrative example
Not a client result: a team plans to cut a Google campaign after its first 12 leads show low quality. The report is changed to show sample sizes and cohort ages. After four weeks and more leads, the campaign's qualification rate is similar to others, and its cost per qualified lead is acceptable. The cut is avoided.
Frequently asked questions
How many leads do I need before judging a campaign?
There is no single number, but tens of leads with a fair follow-up window give a much better picture than a handful. For close comparisons, you need more.
Should I use statistical tests for lead quality?
They can help for important decisions, but most teams benefit more from showing sample sizes, waiting for mature cohorts and looking at trends.
Next step
Fair comparisons lead to better budget decisions. See my approach to real estate lead generation in Dubai, read about cost per qualified lead, or ask me to review your quality report.
Explore the wider framework: Real estate lead generation Dubai.
What does this look like in your team?
If your team is working through a similar challenge, get in touch to discuss where a focused review could help.
Discuss your real estate campaign